

Thema     : Kleine und/oder umfangreiche oder/und detaillierte Systeminformationen
Zielgruppe: Linux-Nutzer mit fundierten Shell-Kenntnissen
Motivation: Unix-artige Systeme verstehen und beherrschen
Hinweis   : Smartphone auf breite Ansicht drehen
Gut zu wissen
Es gibt sehr viele Möglichkeiten sich Systeminformationen zu holen. Das Besondere in diesem Beitrag, alle hier gezeigten Befehle können ohne erweiterte Rechte genutzt werden, wenn sie einmal installiert sind. Meine Empfehlung ist inxi.
Inhaltsverzeichnis
- Gut zu wissen
- 1. Minimale Systemübersicht
- 2. Systemübersicht
- 3. Systeminformationen mit GUI
- 4. System-Info einzelner Module
- 5. Prozesse
- 6. Dateisystem
- 7. Drucker
- 8. Monitoring
Uname screenfetch LS dir tree PS top htop
1. Minimale Systemübersicht
uname -a
$ uname -a
Linux test 6.0.0-1-generic #1 SMP Debian 5.10.140-1 (2022-10-09) x86_64 GNU/Linux
neofetch und screenfetch
$ neofetch
MMMMMMMMMMMMMMMMMMMMMMMMMMMMMMNMMMMMMMMM   test@test
MMMMMMMMMMNs..yMMMMMMMMMMMMMm: +NMMMMMMM   ---------
MMMMMMMMMN+    :mMMMMMMMMMNo` -dMMMMMMMM   OS: MX x86_64
MMMMMMMMMMMs.   `oNMMMMMMh- `sNMMMMMMMMM   Host: VirtualBox 1.2
MMMMMMMMMMMMN/    -hMMMN+  :dMMMMMMMMMMM   Kernel: 6.0.0-1-generic
MMMMMMMMMMMMMMh-    +ms. .sMMMMMMMMMMMMM   Uptime: 2 mins
MMMMMMMMMMMMMMMN+`   `  +NMMMMMMMMMMMMMM   Shell: bash 5.1.4
MMMMMMMMMMMMMMNMMd:    .dMMMMMMMMMMMMMMM   Resolution: 1895x1510
MMMMMMMMMMMMm/-hMd-     `sNMMMMMMMMMMMMM   DE: Xfce 4.18
MMMMMMMMMMNo`   -` :h/    -dMMMMMMMMMMMM   WM: Xfwm4
MMMMMMMMMd:       /NMMh-   `+NMMMMMMMMMM   WM Theme: mx-comfort
MMMMMMMNo`         :mMMN+`   `-hMMMMMMMM   Theme: mx-comfort [GTK2], Adwaita [GTK3]
MMMMMMh.            `oNMMd:    `/mMMMMMM   Icons: Papirus-mxblue-darkpanes [GTK2], Adwaita [GTK3]
MMMMm/                -hMd-      `sNMMMM   Terminal: xfce4-terminal
MMNs`                   -          :dMMM   Terminal Font: Liberation Mono 11
Mm:                                 `oMM   CPU: AMD Ryzen 7 2700X (2) @ 3.699GHz
MMMMMMMMMMMMMMMMMMMMMMMMMMMMMMMMMMMMMMMM   GPU: VMware SVGA II Adapter
                                           Memory: 673MiB / 1982MiB

less – head – cat – lsb_release – ls
Mit diesen und weiteren Befehlen, können Dateiinhalte, unter anderem von Systeminformationen, wiedergegeben werden.
head
$ head /etc/os-release
PRETTY_NAME="Debian GNU/Linux 11 (bullseye)"
NAME="Debian GNU/Linux"
VERSION_ID="11"
VERSION="11 (bullseye)"
VERSION_CODENAME=bullseye
ID=debian
HOME_URL="https://www.debian.org/"
SUPPORT_URL="https://www.debian.org/support"
BUG_REPORT_URL="https://bugs.debian.org/"
lsb_release
$ lsb_release -a
No LSB modules are available.
Distributor ID:	Debian
Description:	Debian GNU/Linux 11 (bullseye)
Release:	11
Codename:	bullseye
ls
$ ls /usr/bin/*session
/usr/bin/dbus-run-session  /usr/bin/xfce4-session
2. Systemübersicht
inxi
Die vollständigste Ansicht wäre mit der Option v8, also inxi -v8. Doch das Beispiel wäre zu groß für diesen Beitrag.
$ inxi -Fxz
System:    Kernel: 6.0.0-1-generic x86_64 bits: 64 compiler: gcc v: 10.2.1 Desktop: Xfce 4.18.0
           Distro: MX-21.2.1_x64 Rose October 9  2022 base: Debian GNU/Linux 11 (bullseye)
Machine:   Type: Virtualbox System: innotek product: VirtualBox v: 1.2 serial: <filter>
           Mobo: Oracle model: VirtualBox v: 1.2 serial: <filter> BIOS: innotek v: VirtualBox
           date: 12/01/2006
CPU:       Info: Dual Core model: Pentium VIII bits: 64 type: MCP arch: Lake rev: 2 cache: L2
           L2: 1024 KiB
           flags: avx avx2 lm nx pae sse sse2 sse3 sse4_1 sse4_2 sse4a ssse3 bogomips: 14799
           Speed: 3700 MHz min/max: N/A Core speeds (MHz): 1: 3700 2: 3700
Graphics:  Device-1: VMware SVGA II Adapter driver: vmwgfx v: 2.18.0.0 bus-ID: 00:02.0
           Display: x11 server: X.Org 1.20.11 driver: loaded: vmware
           unloaded: fbdev,modesetting,vesa resolution: 1895x1510~60Hz
           OpenGL: renderer: llvmpipe (LLVM 11.0.1 256 bits) v: 4.5 Mesa 20.3.5
           direct render: Yes
Audio:     Device-1: Intel 82801AA AC97 Audio vendor: Dell driver: snd_intel8x0 v: kernel
           bus-ID: 00:05.0
           Sound Server-1: ALSA v: k5.10.0-18-amd64 running: yes
           Sound Server-2: PulseAudio v: 14.2 running: yes
Network:   Device-1: Intel 82540EM Gigabit Ethernet driver: e1000 v: kernel port: d020
           bus-ID: 00:03.0
           IF: eth0 state: up speed: 1000 Mbps duplex: full mac: <filter>
           Device-2: Intel 82371AB/EB/MB PIIX4 ACPI type: network bridge driver: piix4_smbus
           v: N/A port: d200 bus-ID: 00:07.0
Drives:    Local Storage: total: 16 GiB used: 6.81 GiB (42.6%)
           ID-1: /dev/sda vendor: VirtualBox model: VBOX HARDDISK size: 16 GiB
Partition: ID-1: / size: 14.78 GiB used: 6.81 GiB (46.1%) fs: ext4 dev: /dev/sda1
Swap:      ID-1: swap-1 type: partition size: 896 MiB used: 0 KiB (0.0%) dev: /dev/sda2
Sensors:   Message: No sensor data found. Is lm-sensors configured?
Info:      Processes: 170 Uptime: 7m Memory: 1.94 GiB used: 678.8 MiB (34.2%) Init: SysVinit
           runlevel: 5 Compilers: gcc: N/A Packages: 1971 Shell: Bash v: 5.1.4 inxi: 3.3.06
hwinfo
Die Ausgabe von hwinfo ist so groß, das man sie Seitenweise anfordert oder in ene Textdatei umleitet. Es ist auch möglich die Ausgabe in Blindenschrift erstellen zu lassen.
$ hwinfo > hwinfo.txtDie einzelnen Module für einen gezielten Abruf der Informationen sind folgende.
all, arch, bios, block, bluetooth, braille, bridge, camera, cdrom, chipcard, cpu, disk, dsl, dvb, fingerprint, floppy, framebuffer, gfxcard, hub, ide, isapnp, isdn, joystick, keyboard, memory, mmc-ctrl, modem, monitor, mouse, netcard, network, partition, pci, pcmcia, pcmcia-ctrl, pppoe, printer, redasd, reallyall, scanner, scsi, smp, sound, storage-ctrl, sys, tape, tv, uml, usb, usb-ctrl, vbe, wlan, xen, zip
Dieser Befehl eignet sich für Scripte um mit grep und sed gezielte Informationen als Variablen zu nutzen.
lshw
Dieses Kommando ist nicht so umfangreich wie hwinfo, aber leicht verständlich, fast wie inxi. Es bietet von Haus aus aber schon den Export als Baumansicht in html, xml und json an.
$ lshw --help
Hardware Lister (lshw) -
usage: lshw [-format] [-options ...]
       lshw -version

	-version        print program version ()

format can be
	-html           output hardware tree as HTML
	-xml            output hardware tree as XML
	-json           output hardware tree as a JSON object
	-short          output hardware paths
	-businfo        output bus information

options can be
	-class CLASS    only show a certain class of hardware
	-C CLASS        same as '-class CLASS'
	-c CLASS        same as '-class CLASS'
	-disable TEST   disable a test (like pci, isapnp, cpuid, etc. )
	-enable TEST    enable a test (like pci, isapnp, cpuid, etc. )
	-quiet          don't display status
	-sanitize       sanitize output (remove sensitive information like serial numbers, etc.)
	-numeric        output numeric IDs (for PCI, USB, etc.)
	-notime         exclude volatile attributes (timestamps) from output
3. Systeminformationen mit GUI
An erster Stelle ist da HardInfo bezeihungsweise „System-Informationen“ beziehungsweise hardinfo.
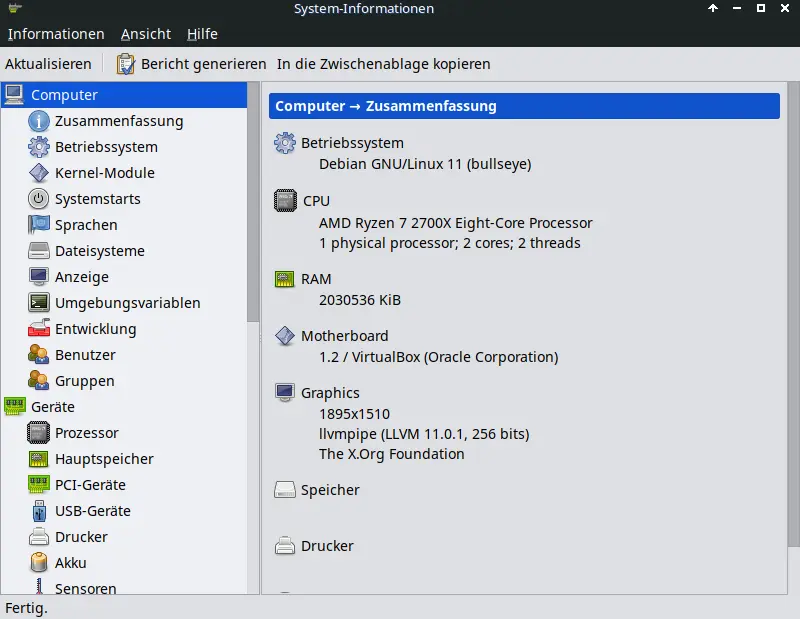
Die grafische Darstellung ist auch mit lswh-gtk möglich für Desktop-Umgebungen, also DE, auf GTK.
Für den KDE-Desktop gibt es kinfocenter.
4. System-Info einzelner Module
Für jede einzelne Aufgabe gibt es gesonderte Informationssysteme, hier Beispiele:
Am meisten wird wohl der ls<group> genutzt, so zumindest in den Foren. Hier Beispiele.
lspci
$ lspci
00:00.0 Host bridge: Intel Corporation 440FX - 82441FX PMC [Natoma] (rev 02)
00:01.0 ISA bridge: Intel Corporation 82371SB PIIX3 ISA [Natoma/Triton II]
00:01.1 IDE interface: Intel Corporation 82371AB/EB/MB PIIX4 IDE (rev 01)
00:02.0 VGA compatible controller: VMware SVGA II Adapter
00:03.0 Ethernet controller: Intel Corporation 82540EM Gigabit Ethernet Controller (rev 02)
00:04.0 System peripheral: InnoTek Systemberatung GmbH VirtualBox Guest Service
00:05.0 Multimedia audio controller: Intel Corporation 82801AA AC'97 Audio Controller (rev 01)
00:06.0 USB controller: Apple Inc. KeyLargo/Intrepid USB
00:07.0 Bridge: Intel Corporation 82371AB/EB/MB PIIX4 ACPI (rev 08)
00:0d.0 SATA controller: Intel Corporation 82801HM/HEM (ICH8M/ICH8M-E) SATA Controller [AHCI mode] (rev 02)
lsusb
$ lsusb
Bus 001 Device 002: ID 80ee:0021 VirtualBox USB Tablet
Bus 001 Device 001: ID 1d6b:0001 Linux Foundation 1.1 root hub
ls<Parameter>
Weiter stehen noch lsmod, lsscsi, lsblk, lscpu und lsdev zur Verfügung.
Weitere Hardware-Informationen
• Akku-Status, batmon.app
• Fenster-Informationen, wininfo
• Festplatten-Verwaltungen, gsmartcontrol
• Log-Dateien-Betrachter, glogg, ksystemlog
• Netzwerk-Traffic, gnome-nettool
• Router-Kontrolle, upnp-router-control
• Satelliten-Verfolgung, gpredict
• Sensoren-Informationen, xsensors
• Unity-Desktop-Umgebung, unity-control-center
5. Prozesse
Übersicht bieten top und htop.
top
$ top
top - 11:26:39 up 3:01, 1 user, load average: 0,04, 0,01, 0,00
Tasks: 165 total, 1 running, 164 sleeping, 0 stopped, 0 zombie
%CPU(s): 0,0 us, 0,0 sy, 0,0 ni,100,0 id, 0,0 wa, 0,0 hi, 0,0 si, 0,0 st
MiB Spch: 1982,9 total, 342,6 free, 495,4 used, 1144,9 buff/cache
MiB Swap: 896,0 total, 896,0 free, 0,0 used. 1303,2 avail Spch
PID USER PR NI VIRT RES SHR S %CPU %MEM ZEIT+ BEFEHL
2015 root 20 0 908040 95340 37036 S 0,3 4,7 0:17.35 Xorg
2458 test 20 0 593004 46308 35888 S 0,3 2,3 0:05.87 panel-5-pulseau
9285 test 20 0 79820 3912 3396 R 0,3 0,2 0:00.01 top
1 root 20 0 3356 1984 1828 S 0,0 0,1 0:01.09 init
2 root 20 0 0 0 0 S 0,0 0,0 0:00.01 kthreadd
3 root 0 -20 0 0 0 I 0,0 0,0 0:00.00 rcu_gp
4 root 0 -20 0 0 0 I 0,0 0,0 0:00.00 rcu_par_gp
6 root 0 -20 0 0 0 I 0,0 0,0 0:00.00 kworker/0:0H-events_highpri
8 root 0 -20 0 0 0 I 0,0 0,0 0:00.20 kworker/0:1H-events_highpri
9 root 0 -20 0 0 0 I 0,0 0,0 0:00.00 mm_percpu_wq
10 root 20 0 0 0 0 S 0,0 0,0 0:00.00 rcu_tasks_rude_
11 root 20 0 0 0 0 S 0,0 0,0 0:00.00 rcu_tasks_trace
12 root 20 0 0 0 0 S 0,0 0,0 0:00.02 ksoftirqd/0
13 root 20 0 0 0 0 I 0,0 0,0 0:00.94 rcu_sched
14 root rt 0 0 0 0 S 0,0 0,0 0:00.03 migration/0
16 root 20 0 0 0 0 S 0,0 0,0 0:00.00 cpuhp/0
17 root 20 0 0 0 0 S 0,0 0,0 0:00.00 cpuhp/1
18 root rt 0 0 0 0 S 0,0 0,0 0:00.17 migration/1
19 root 20 0 0 0 0 S 0,0 0,0 0:00.06 ksoftirqd/1
21 root 0 -20 0 0 0 I 0,0 0,0 0:00.00 kworker/1:0H-events_highpri
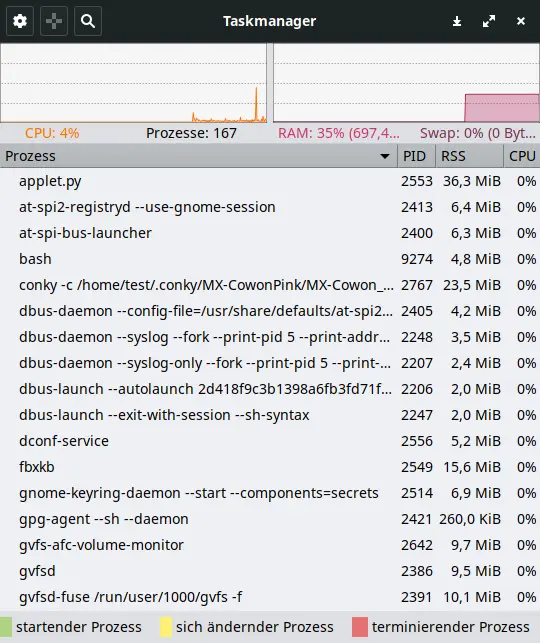
24 root 20 0 0 0 0 S 0,0 0,0 0:00.00 kdevtmpfs Taskmanager
Mit GUI gibt es für Prozessmonitoring die Taskmanagers. Hier der xfce4-taskmanger als Beispiel.
6. Dateisystem
Vermutlich der meist genutzte Befehl für die Abfrage von Inhalten in Verzeichnissen ist dir. Hier mal Alternativen.
ls
Der ls Befehl hat sehr viele Möglichkeiten sich den Inhalten von Verzeichnissen anzeigen zu lassen. Siehe dazu die Hilfeseite unter ls --help.
$ ls -aA
.bash_history  Musik
.bash_logout   Öffentlich
.bashrc        .profile
Bilder         .restore
.cache         .rpmdb
.config        Schreibtisch
.conky         .thunderbird
.dbus          .vboxclient-clipboard.pid
.dmrc          .vboxclient-display-svga-x11.pid
Dokumente      .vboxclient-draganddrop.pid
Downloads      .vboxclient-seamless.pid
.gdmap         Videos
.gnupg         Vorlagen
.hardinfo      .wget-hsts
.ICEauthority  wget-log
.inputrc       .Xauthority
.local         .xsession-errors
.mozilla       .xsession-errors.old
du
Interessant für Speiecherverbrauch von Verzeichnissen. Hier ein Beispiel im §HOME-Verzeichnis mit 216MB Gesamtbelegung.
~ $ du -hs
216M	.
df
Auch sympatisch mit „human read“ der Größenangabe.
$ df -hT
Dateisystem    Typ      Größe Benutzt Verf. Verw% Eingehängt auf
udev           devtmpfs  951M       0  951M    0% /dev
tmpfs          tmpfs     199M    864K  198M    1% /run
/dev/sda1      ext4       15G    6,9G  7,2G   49% /
tmpfs          tmpfs     5,0M    8,0K  5,0M    1% /run/lock
tmpfs          tmpfs     576M       0  576M    0% /dev/shm
cgroup         tmpfs      12K       0   12K    0% /sys/fs/cgroup
tmpfs          tmpfs     199M     12K  199M    1% /run/user/1000
tree
Zeigt einen schönen Verzeichnisbaum, aber muss bei einigen Distros nachinstalliert werden. Bitte das Ausgangsverzeichnis und die Verzeichnisstiefe beachten, ansonsten bekommt man alles angezeigt. Hier ein extrem kurzer Verzeichnisbaum mit Level2, also Ausgangsverzeichnis und nur desen Unterverzeichnisse.
$ tree -L 2
.
├── Bilder
├── Dokumente
├── Downloads
│ └── rustdesk-1.1.9.deb
├── Musik
├── Öffentlich
├── Schreibtisch
│ ├── FAQ.desktop
│ ├── Help.desktop
│ └── rustdesk.desktop
├── Videos
├── Vorlagen
└── wget-log
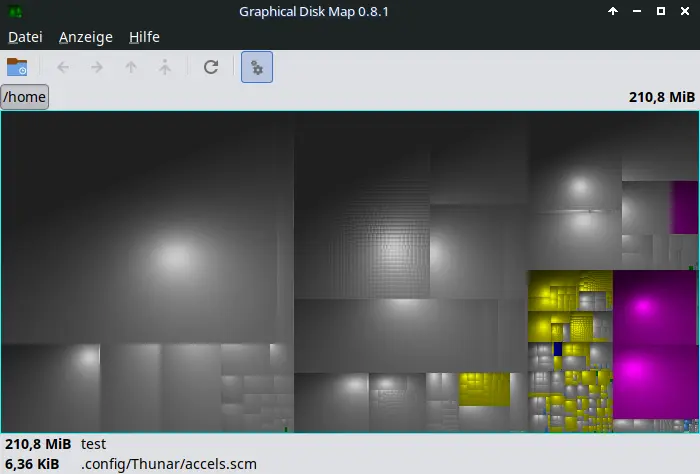
8 directories, 5 filesGrafische Werkzeuge für Speicherplatzbelegung
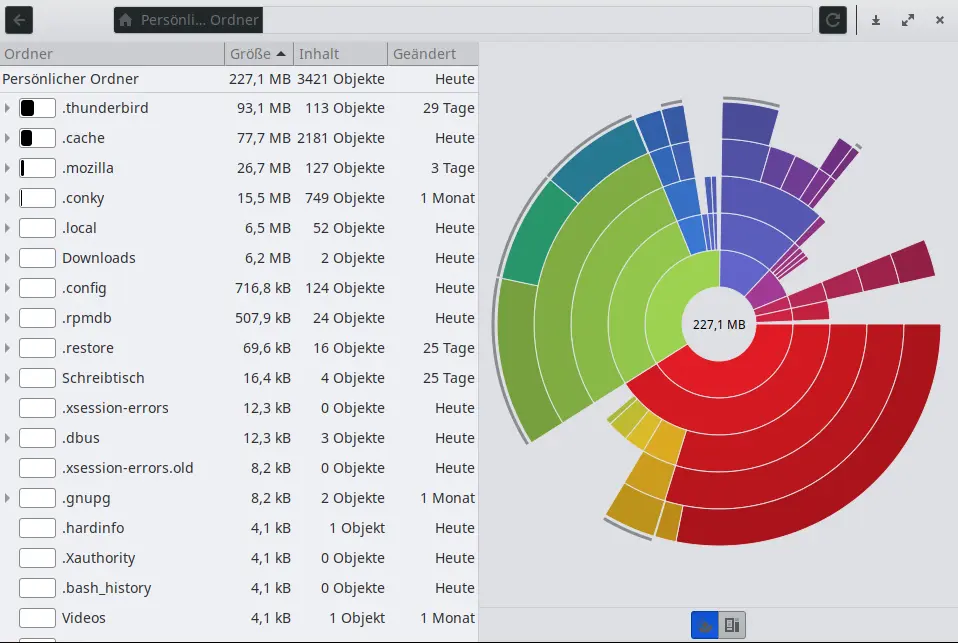
Da gibt es, wie unter Linux typisch, wieder für jeden Geschmack etwas. Mir gefällt gdmap.
Aber zur Zeit ist baobab bei den Distros populär.
7. Drucker
Das mit den Druckern ist immer eine Extra-Kiste, so wie Pilze, weder Fauna noch Flora.
Am besten das Webinterface aufrufen, da hat man die schnelle und volle Kontrolle.
http://localhost:631/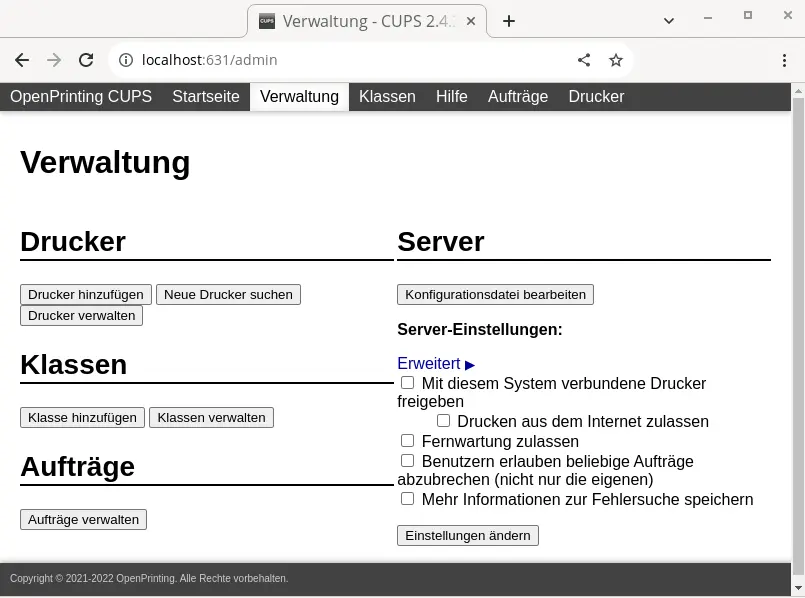
8. Monitoring
Wer das Terminal beherrscht, insbesondere Multiplexer, kann dort sich ein Monitoring bauen. Idealerweise schnell über aliases.
Nun noch zwei grafische Ansätze.
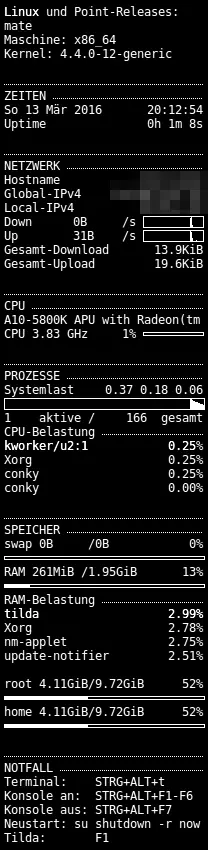
conky
Für die laufende Kontrolle des Systems empfiehlt sich conky mit der Möglichkeit sehr fein granuliert Informationen abzufragen und das ganze noch mit einer Variabilität im Layout, das keine Wünsche offen lässt.
gkrellm
Ja, gkrellm gibts auch.